Problem Identification
Drunk driving is a very serious issue across the country. Drinking and driving kills 28 people a day in the U.S. — about one person every 52 minutes, according to the National Highway Traffic Safety Administration. We took publicly-available data and dug into the issues at the center of the problem. State agencies and non-profits have limited budgets. Focusing on a few key findings that drive higher OWI revocation rates in certain counties could help those organization focus limited budgets on the right strategies to help significantly reduce drunk driving fatalities.

Deliverables
Influencers that appear directly tied to higher or lower OWI revocation rates. Does something significantly increase or decrease OWI revocation rates in Iowa? It’s important to know those to make effective recommendations to organizations that could run campaigns to reduce drunk driving.


Linear Regression Model
I started by gathering data on 17 potential impacts on OWI revocations in the state of Iowa between 2013-2019. Before removing features from the model for insignificance, I removed features causing multicollinearity issues such as population. I then adjusted other factors to be percent of population such as Veterans and Registered Voters. I then used p-values with less than 0.05 thresholds.
From there, I narrowed down to five high impact features with p-values under 0.05: White Ethnicity, Registered Democrats, Median Income, Veterans, and Year. I was satisfied with a R-squared value of 0.42 as other trial and error efforts had resulted in much lower R-squared values previously. The residuals show bias. The model is consistently overestimating OWIs for small counties and underestimating for large counties. The predicted plot included above shows my most successful linear regression model and the feature coefficients.
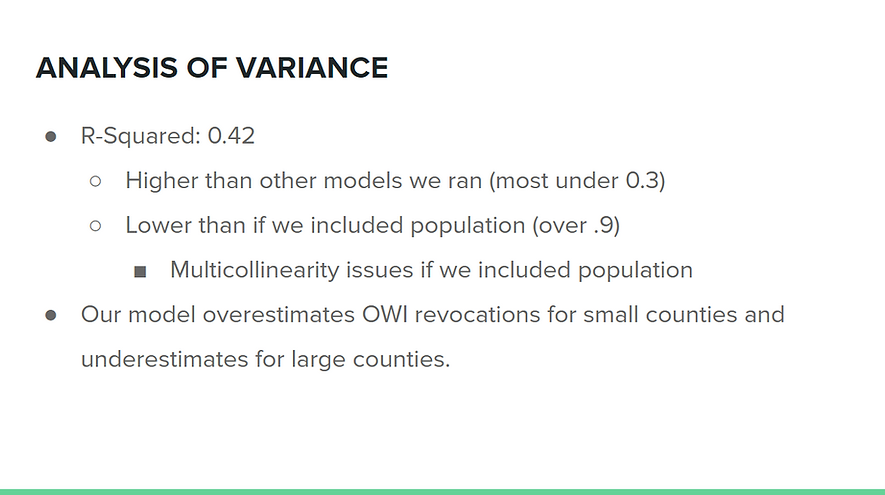
Variance
I could have include population in the model to get an R^2 value of over .9. So why not do it? Well, I had to revisit our original goal. Which counties are the "best" and "worst" when it comes to OWIs? The inclusion of population would eliminate the ability to explore this question since a greater population would surely mean more revocations, rendering the other features obsolete. I was cautious not to include population in any way, shape, or form. For example, registered voters is essentially just population in a different form. To account for this, I changed this to % of population registered.


The Democrat Dilemma
Taking a closer look at the final variables uncovered multiple interesting takeaways. Registered democrats as a final variable in the linear regression model stood out to me in particular. Higher population counties in Iowa are called ‘blue dot red state’ areas meaning that, even though most counties in Iowa are republican, the highest population counties are blue, or democrat. It must be difficult to be a democrat in a republican-dominated state. Our analysis showed counties with higher population percentages of registered democrats have more OWI revocations than those with higher registered republican percentages.
Why does this matter? Knowing this could help reduce OWI revocations. States and non-profits have limited budgets. Focusing on high population counties with more registered democrats could focus the budget where it matters most. Running OWI awareness campaigns there, especially in election years where voting registration numbers are even more accurate than non-election years could make a big impact.

Lessons Learned
Finding enough reliable data and cleaning the data to be usable in JMP and Tableau was a challenge. I spent most of the first half of the semester collecting the 17 potential features, the OWI revocation rates, and then expanding them to as many years back as possible to have more data points. I was scrapping data from government websites. I knew others were going to use this data, so I wanted to make sure it was accurate. I didn’t spend as much time exploring more models because so much time was spent collecting and cleaning the data. I should have found a way to ask for help or divide and conquer that part of the project.